If there’s one phrase I hear in the course of my professional life that’s guaranteed to result in my forehead colliding with a desk multiple times in quick succession (or wall if I’m standing up), it’s ‘attainment gaps’, especially if it’s preceded by the words ‘can you provide me with some….’ and followed by a question mark. I then punch myself in the face and run out of the room.
I just find it extraordinary that we’re still dealing with these half-baked measures. Serious decisions are being made based on data that is taken entirely out of context. Recently the DfE sent letters out to secondary schools that had ‘wide’ attainment gaps between the percentage of pupil premium and non-pupil premium students achieving 5A*-C including English and Maths. Schools on the list included those where pupil premium attainment was higher than that of pupil premium students nationally, perhaps higher even than overall national averages. Meanwhile those schools that had narrow gaps because both groups had similarly low attainment rates, were left off the list. Bonkers!
On the subject of bonkers, I’m a governor of a junior school that failed to get outstanding purely because of the pupil premium attainment gaps identified in the RAISE report. This was despite us pointing out that their VA was not only higher than that of pupil premium nationally, but higher than non-pupil premium nationally, and that their VA had significantly increased on the previous year. So, the pupil premium pupils enter the school at a lower level than their peers and proceed to make fantastic progress but that was not enough. The gap hadn’t closed. And why hadn’t the gap closed? Because of the attainment of the higher ability pupils, particularly with the level 6 (worth 39 points) bumping APS even further. It would seem that the only way out of this situation is to not stretch the higher ability pupils (I don’t advocate this). And anyway, there’s a double agenda to close the gap AND stretch the most able. How does that work? Double bonkers!
And if there’s an 8th circle of data hell (the 7th circle already occupied by levels) it should be reserved for one thing and one thing alone:
SEN attainment gaps
Oh yes! Everyone’s favourite measure. Basically the gap between SEN and non-SEN pupils achieving a particular measure. These are obviously really useful because they tell us that SEN pupils don’t do as well as non-SEN pupils (that was sarcasm, by the way). Often, they’re not even split into the various codes of practice; just all SEN grouped together. Genius.
When I’m asked for SEN attainment gaps, I try to calmly explain why it’s an utterly pointless measure and that perhaps we should be focussing on progress instead. And maybe we shouldn’t be comparing SEN to non-SEN at all. Sometimes my voice goes up an octave and I start ranting. Usually this does no good whatsoever so I punch myself in the face again and run out of the room.
Ofsted
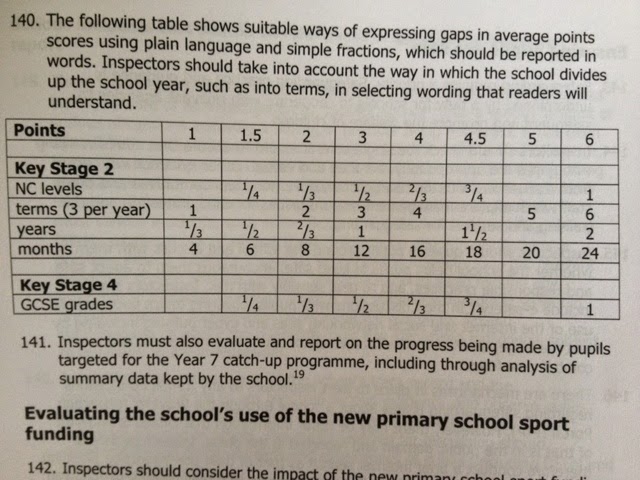
Buried in the old Ofsted subsidiary guidance was the following table of despair:
It tells us that a 3 point gap indicates a year’s difference in ability, and that a 1 point gap equates to a term’s difference. Such language was often found in inspection reports; and this is despite stating that ‘the DfE does not define expected progress in terms of APS’ on page 6 of the same document.
But the times, they are a changing. It is encouraging that this table has been removed from the new handbook. I assume this means no more statements about one group being a year behind another based on APS gaps; and such data having a negative impact on inspections. Ultimately, I hope that the removal of the above table from Ofsted guidance sounds the death knell for this flawed, meaningless and misleading measure, but I won’t hold my breath. I’m sure I’ll have to punch myself in the face a few more times yet.

